A large company with a strong presence in the food industry reached out to KarmaPulse with the aim of “building an internal marketing intelligence system.”
The company had multiple brands, each with its own marketing department, and above them, a general marketing directorate. Each department had different strategies, data needs, and levels of digital maturity. They were the final users of the system.
Marketing leaders needed direct access to consumer data, analyzed according to their own concepts and methods. That was our first goal.
To make common insights accessible and scalable across the company, in order to increase context alignment and shared knowledge between different brands.
This was a necessary step, since intelligence requires data and effective information feedback loops.
What I did
- Ran alignment sessions with stakeholders
- Audited their current data production and consumption processes
- Identified the main job to be done, a consumer analysis process applicable across multiple social channels and brands, with a common taxonomy of marketing categories (product, price, brand, service, etc.)
- Defined an AI-assisted process to automate the analysis
- Deployed a functional prototype in 5 days using Observable Framework for data visualization, and a Python notebook to prototype the initial pipeline (with the great assistance of a data analyst)
- Implemented an initial co-creation program for continuous improvement
Results
- A scalable MVP capable of growing indefinitely in data sources and brands, with customizable analytical categories
- Enhanced, customizable marketing reports in the UI
- Automated qualitative consumer analysis, sensitive to brand and campaign context
- 4 out of 6 major brands received enhanced consumer insight reports
More on the process
For this initial project, I worked only with a senior data analyst. So I happily put hands on both code and design.
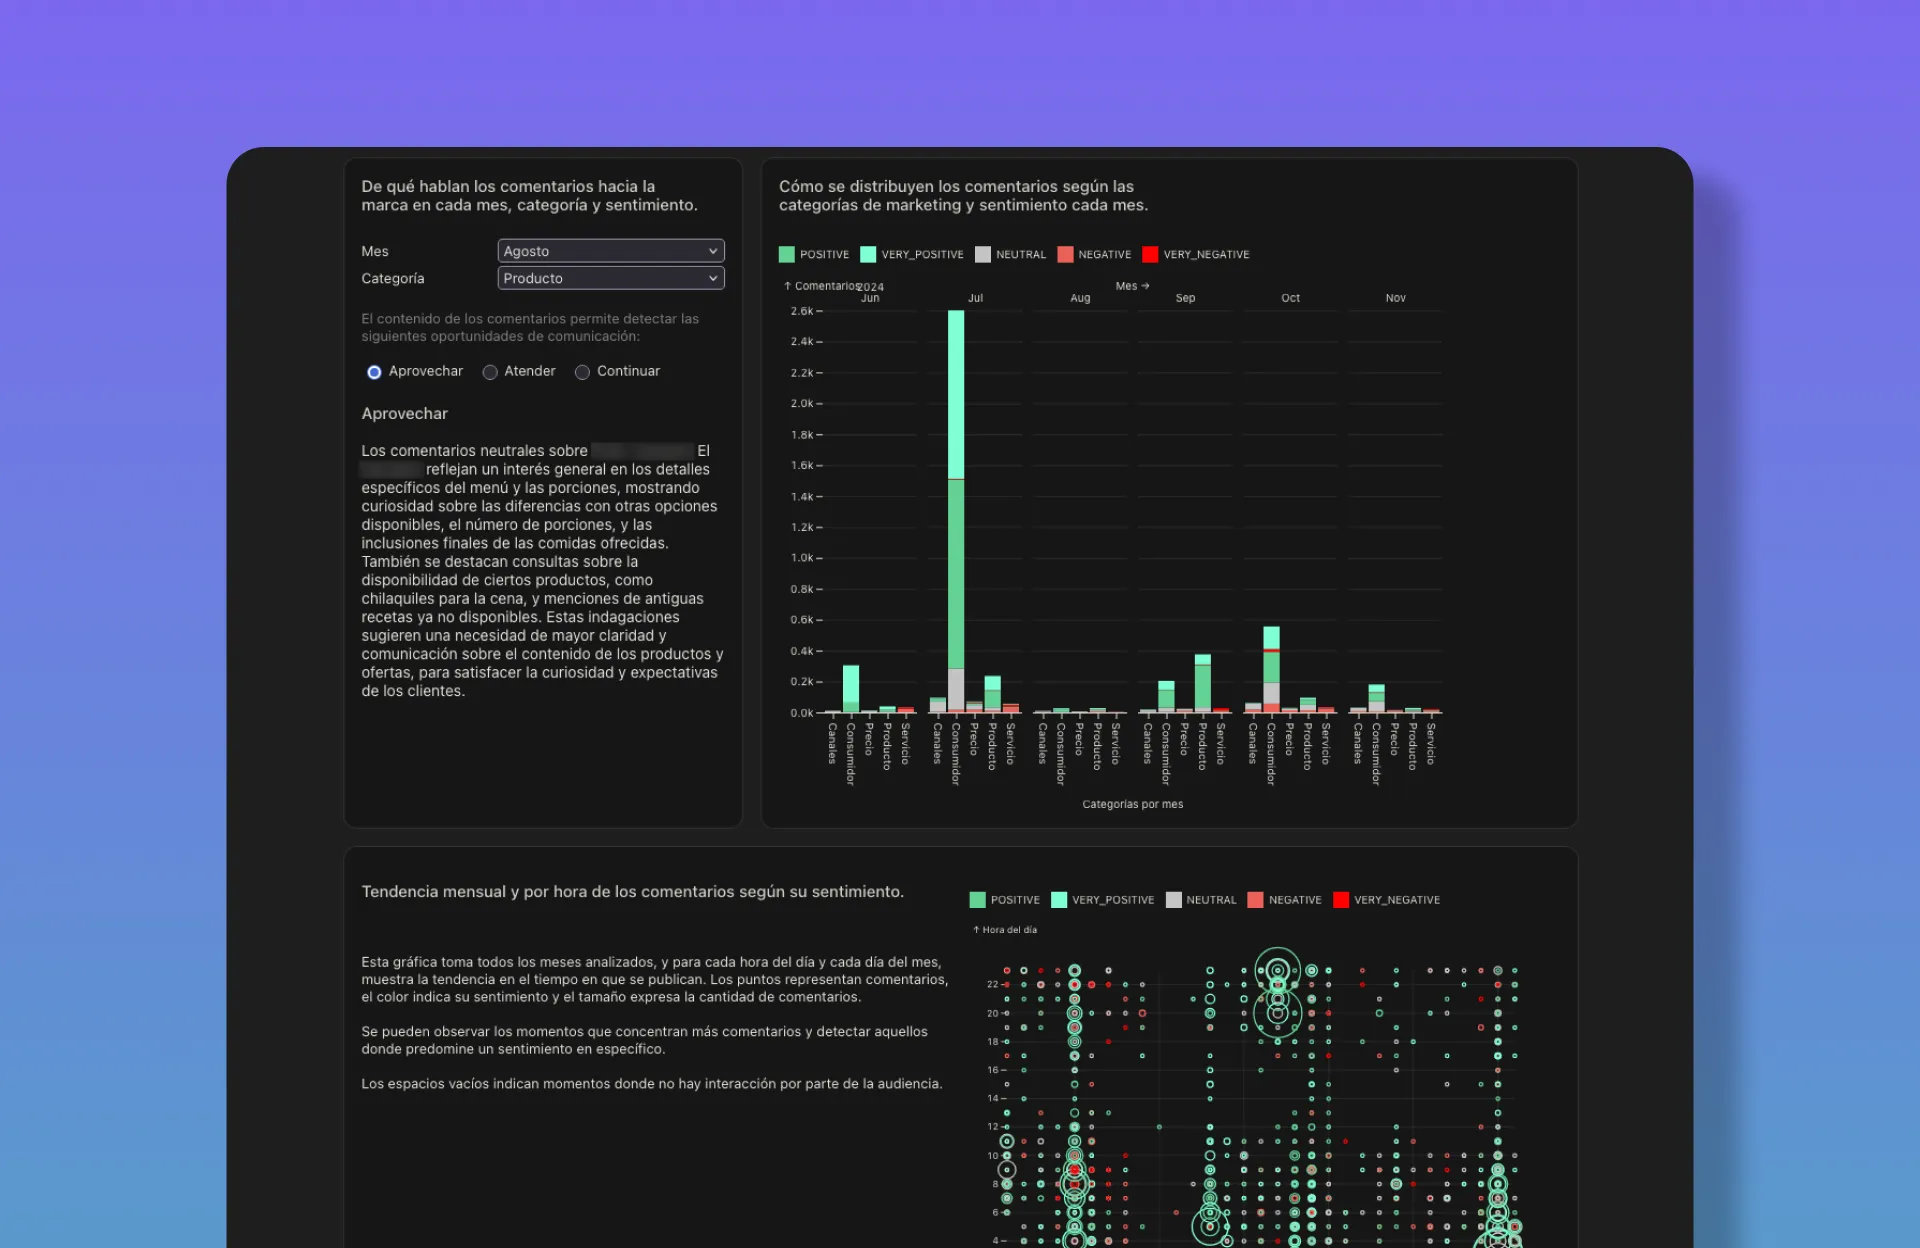
The value of this MVP was not in the UI, but in the initial AI pipeline. Still, data visualization was crucial for testing, alignment, and evaluating the success of the prototype.
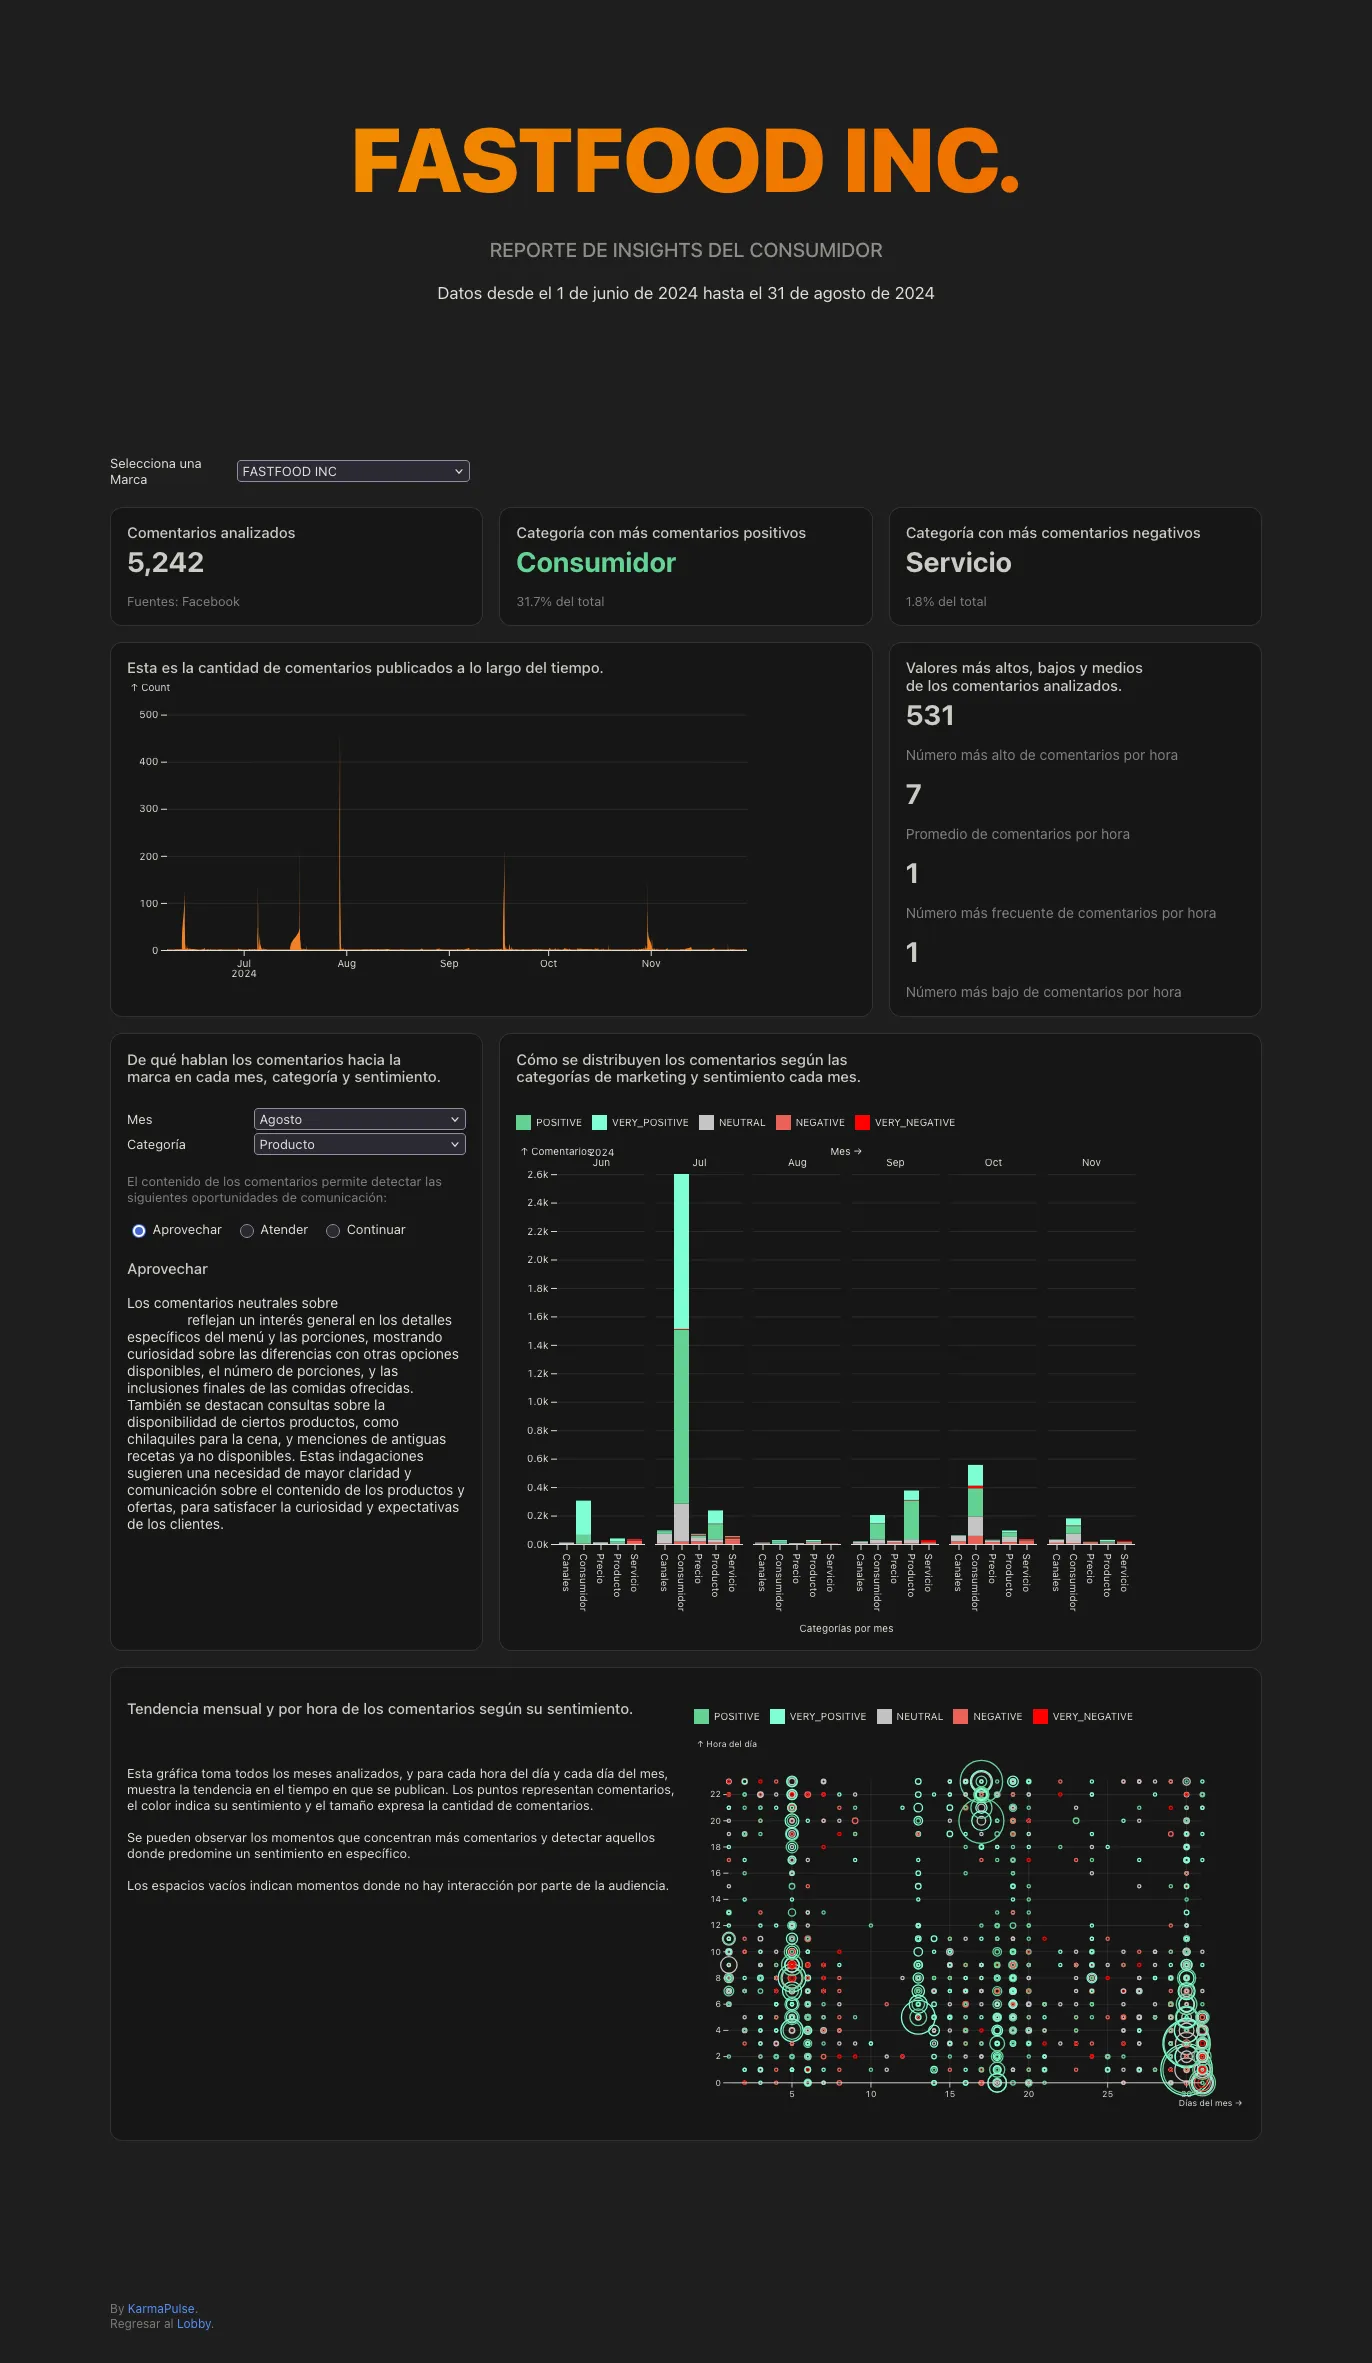
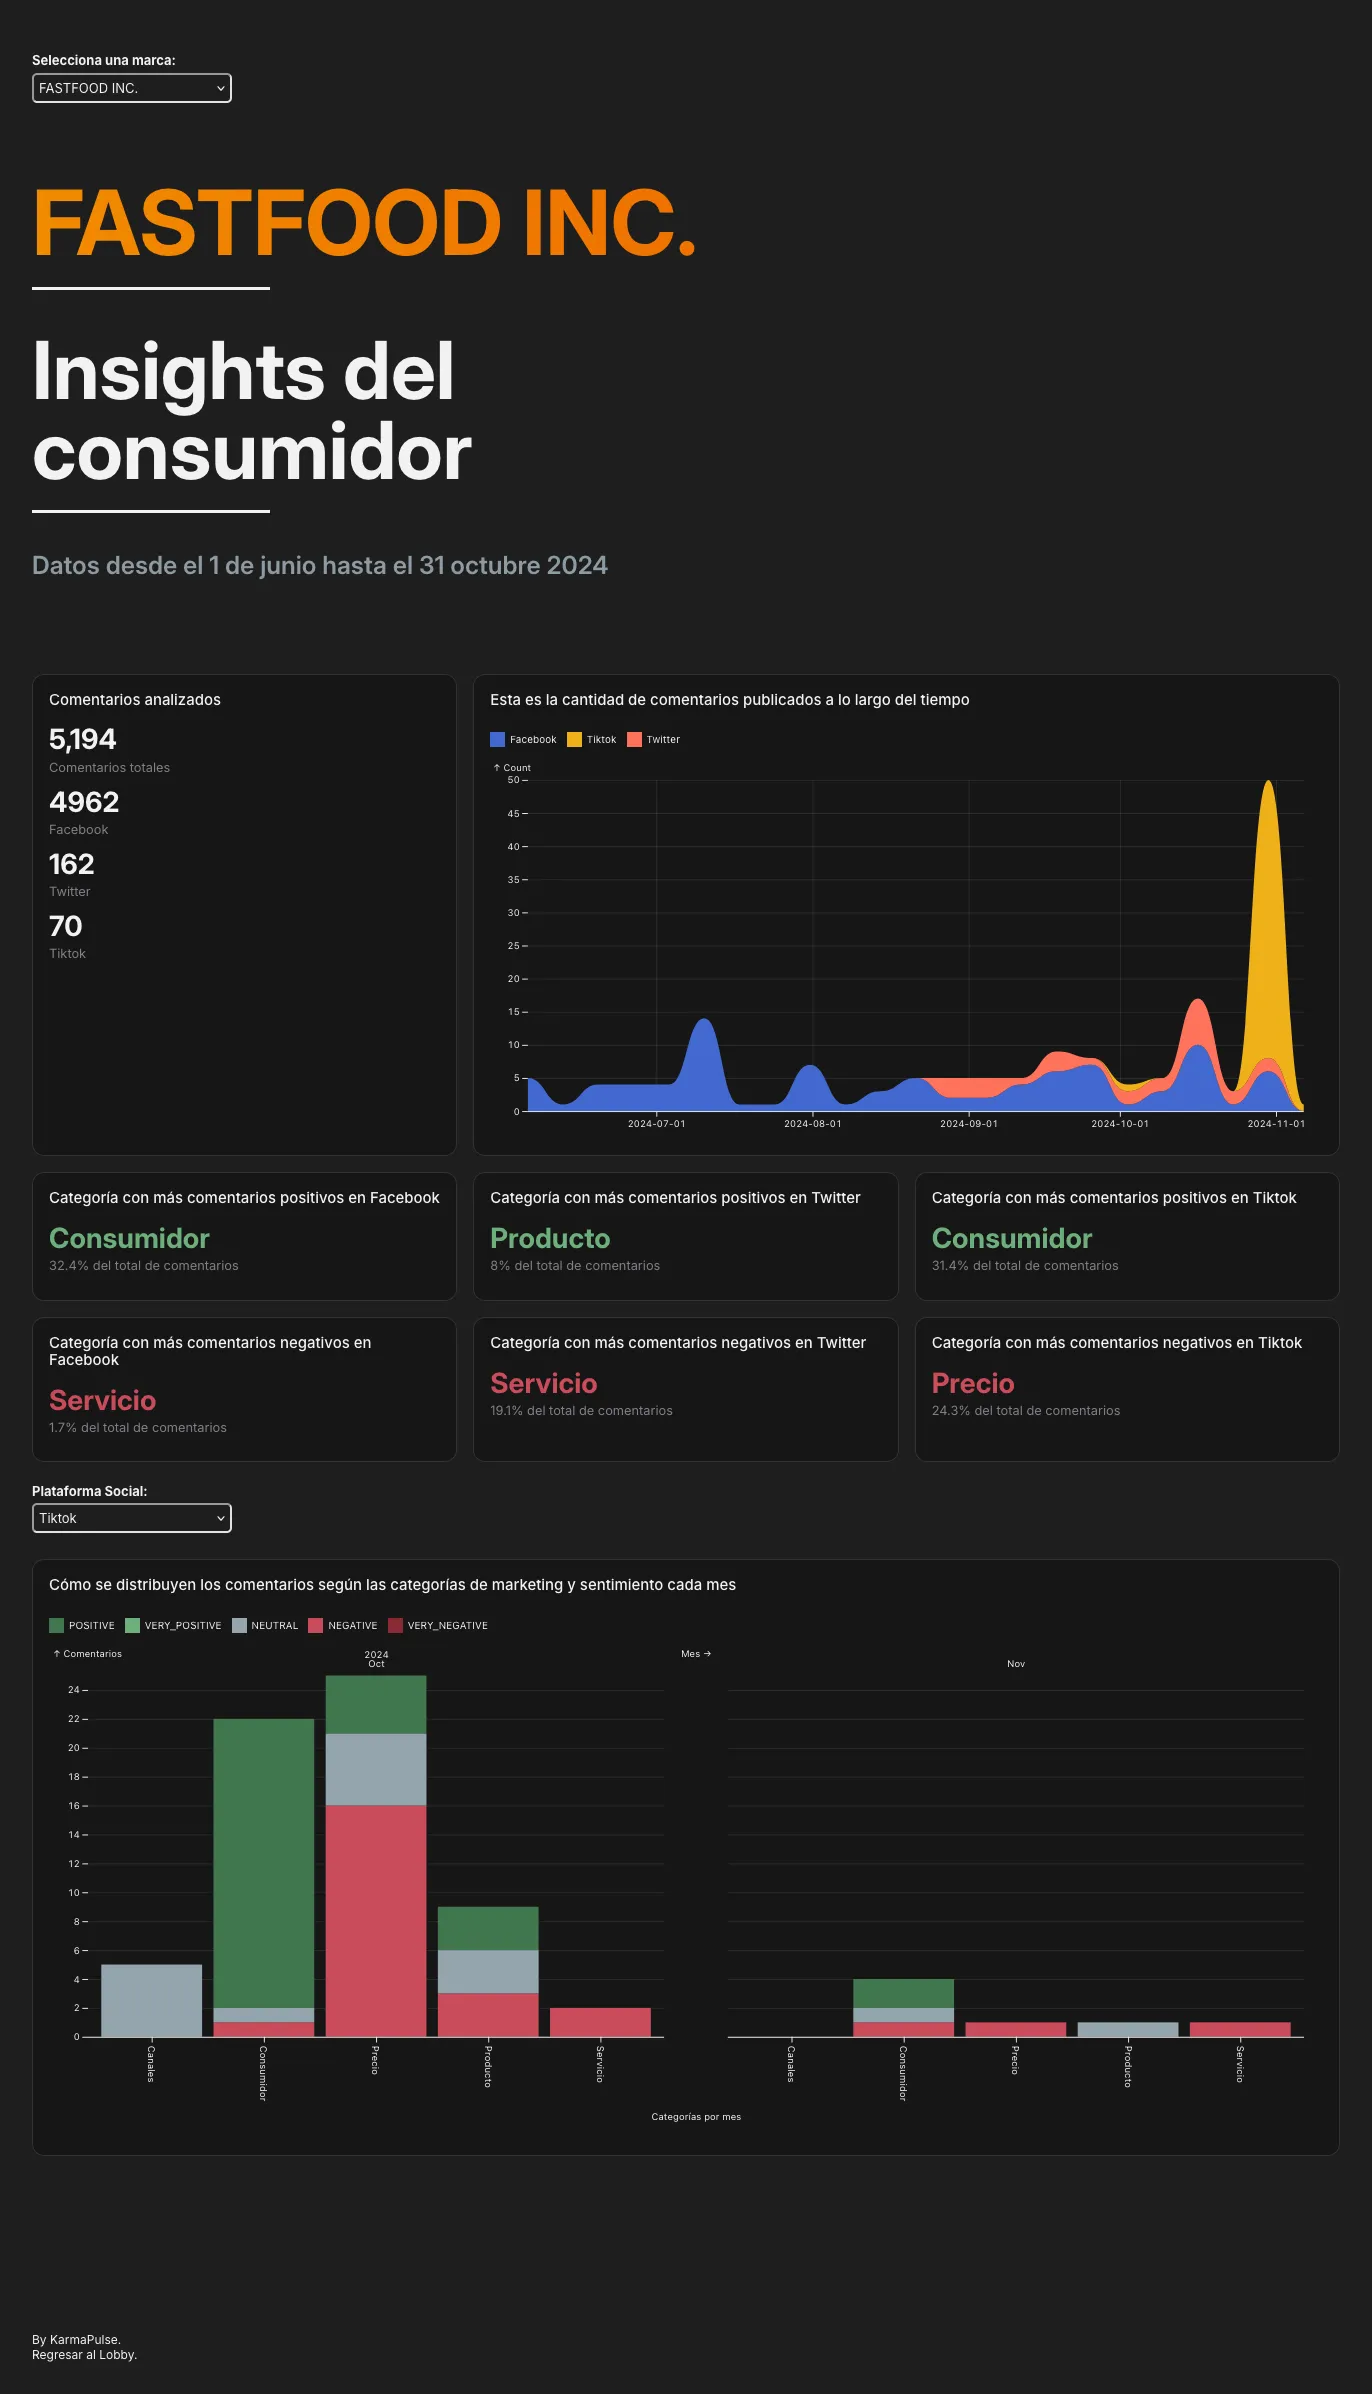
The dashboard’s structure and density changed significantly over the next three months.
The key was to simplify it. Thinking in terms of progressive disclosure in business data visualization proved essential.
This refinement of the problem led me to consider alternative channels to deliver information in a more context-sensitive way. The dashboard became the entry point and a shared space to start conversations between the different marketing teams across brands.
Note: some details and data in the images were changed to protect stakeholder privacy.